This article was originally published here.
In my experience, a handful of ad creatives will usually swallow the vast majority of spend in Facebook ad accounts simply due to their outstanding performance. And those winners often survive months (and sometimes even years) of testing/new challenger creatives. I've seen this sometimes referred to as the "unicorn creative" effort.
I've seen that both offline (TV, direct mail, etc.) and online, but as media buying online has become more automated/algorithmically driven (especially on Facebook and Google) this winner-take-all dynamic has become even more noticeable.
With that in mind, I wanted to do a simple analysis of how much spend the top 10 creatives actually accounted for in our clients' ad accounts. That's actually somewhat easier said than done as every single ad copy variation + title + asset + SLIGHT edit is technically considered a unique creative by Facebook.
To make the data more useful for our purposes, our methodology was as follows:
- We looked at a one-week snapshot of 20 ad accounts (roughly $2.5m in total spend in the observed period)
- Every creative in each ad account was manually reviewed
- If the creative's asset was identical or nearly identical, we tagged them as a single creative
- We ignored slightly different creative edits (ex: different end cards) + copy variations (though that is not to say they aren't important!)
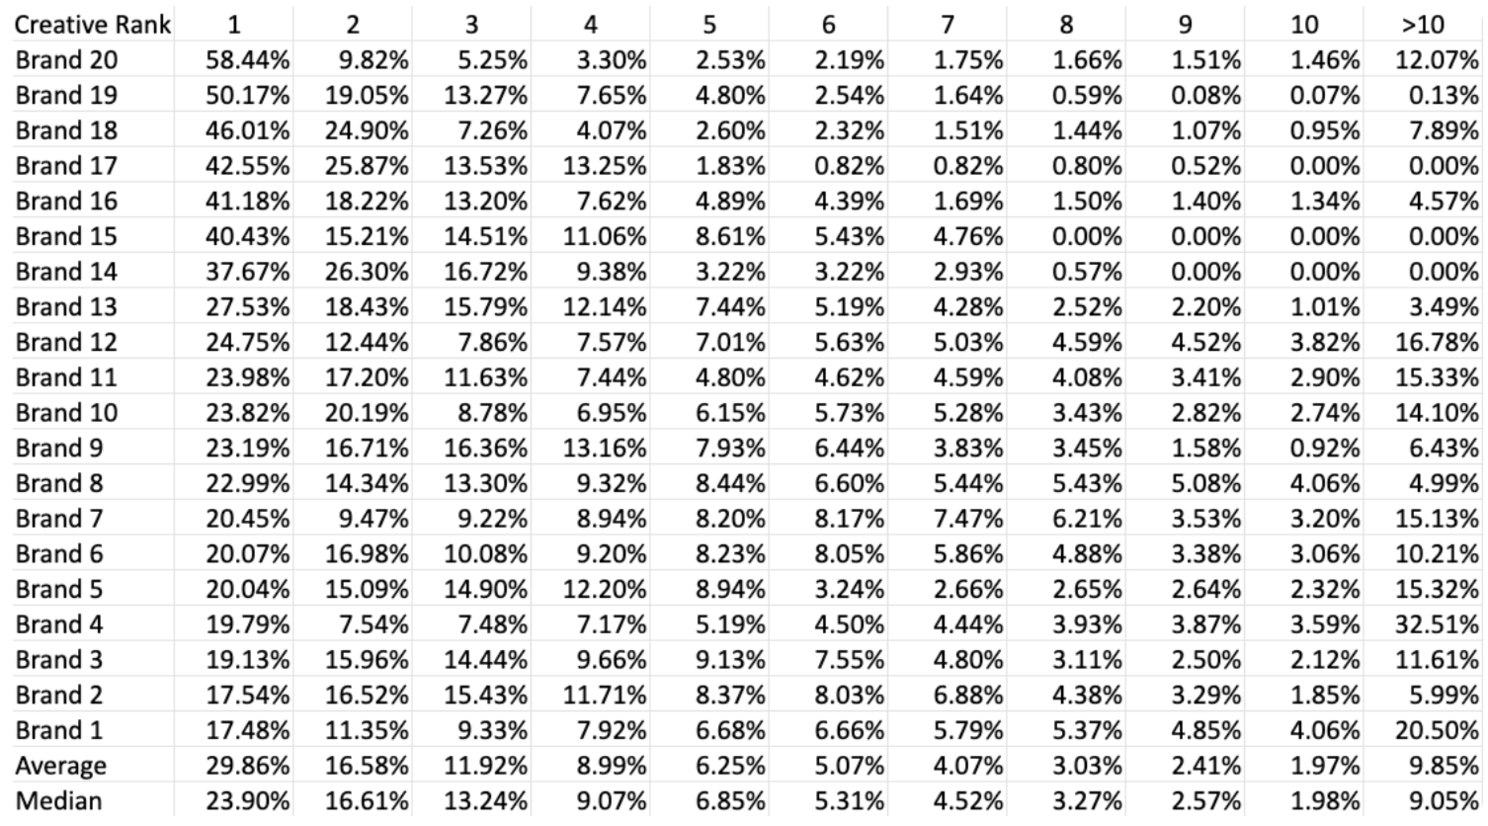
This is what the data looks like in a very raw, relatively hard-to-read table:

So, for example, Brand 20's top spending creative is capturing 58.44% of their total spend. Their second-place creative is capturing 9.82%, third place is 5.25%, and ALL of their creatives not in the top 10 (>10) account for 12.07%.
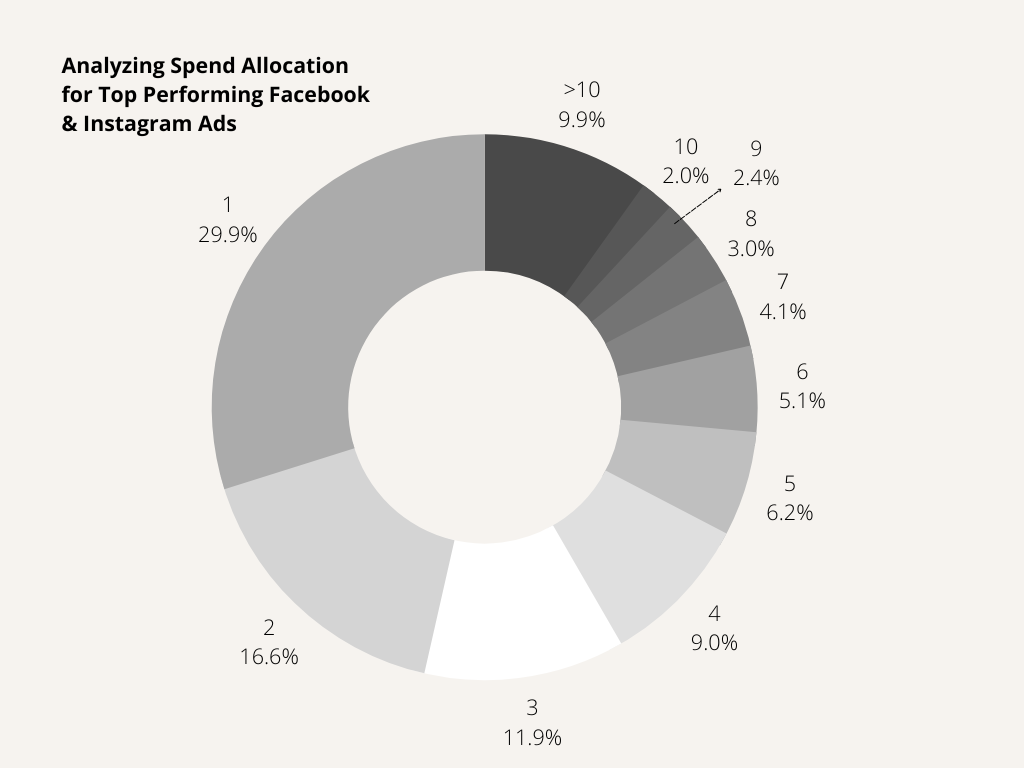
Below is a slightly prettier version of the average data above. On average we see the top creative is capturing roughly 30% of total spend, which is less than I anticipated. The top 3 creatives capture over 50% on average.
