This article was originally published here.
I'm regularly asked what a "normal" mobile conversion rate is in comparison to a site's desktop conversion rate. The reality, of course, is that there is no definitive answer to that. Nonetheless, we set out to at least establish a rule-of-thumb benchmark for that metric.
Methodology
- We pulled YTD Google Analytics data for 15 eCommerce and Lead Gen brands operated in the United States.
- Each of those brands was doing at minimum $20m per year in top-line revenue annually and had a full Universal Google Analytics configuration (mind you UA is being replaced by GA4 soon-ish).
- We pulled conversion rate data for all traffic and we pulled filtered data for Direct, Organic Search, and Paid Search. We recognize that Paid Social traffic grossly over-indexes mobile and so we wanted to look at those other traffic sources to see if the same conversion rate ratios held once that paid social/mobile effect was controlled for.
Results
All Traffic

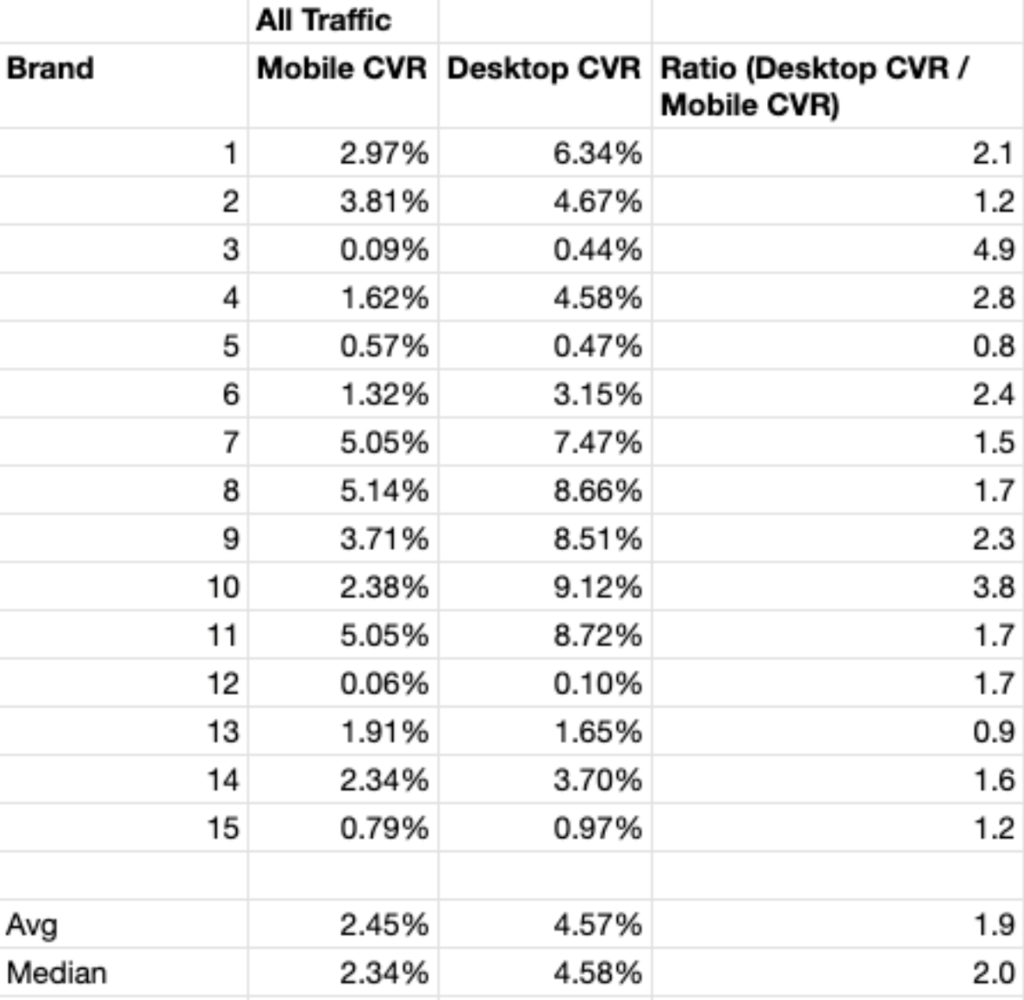
On average, desktop conversion rates for all traffic were 1.9x that of mobile. Obviously, in the data above you can see a ton of variance from brand to brand. That said, intuitively 2x seems like a solid rule of thumb.
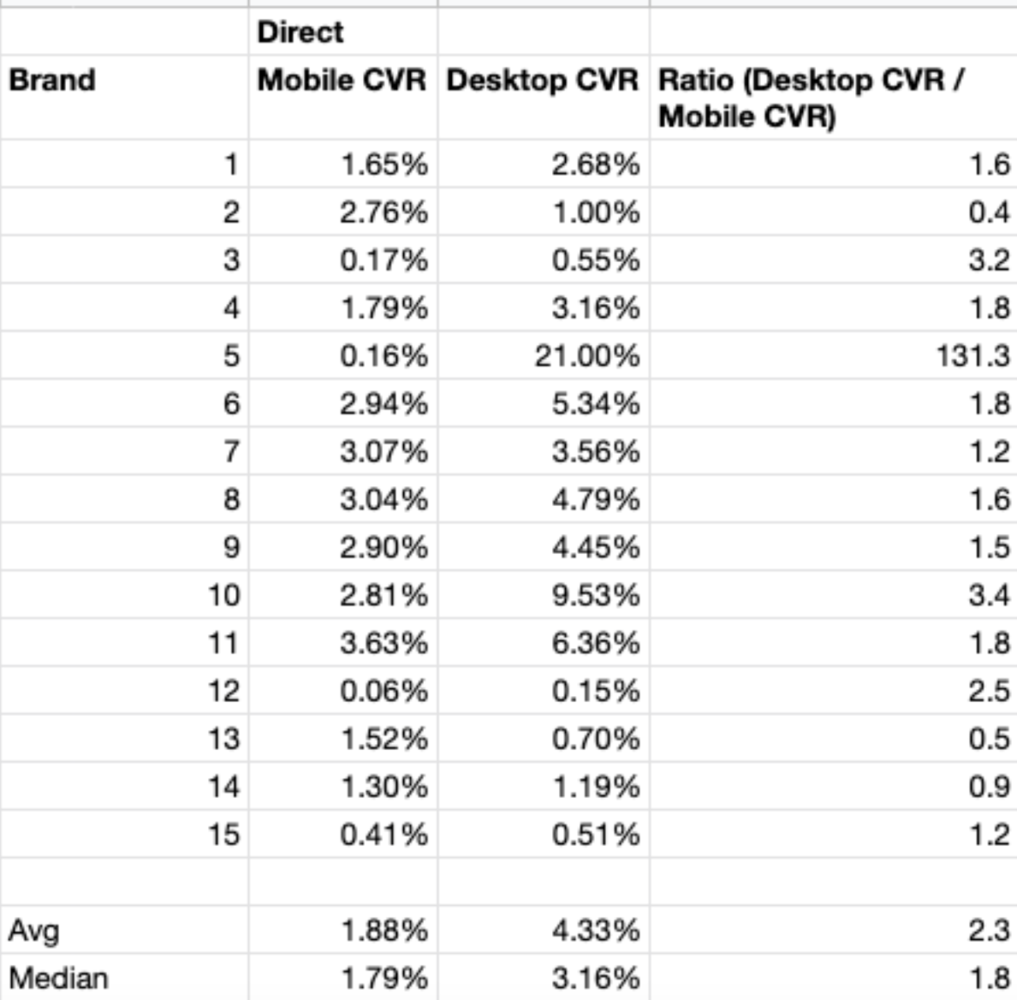
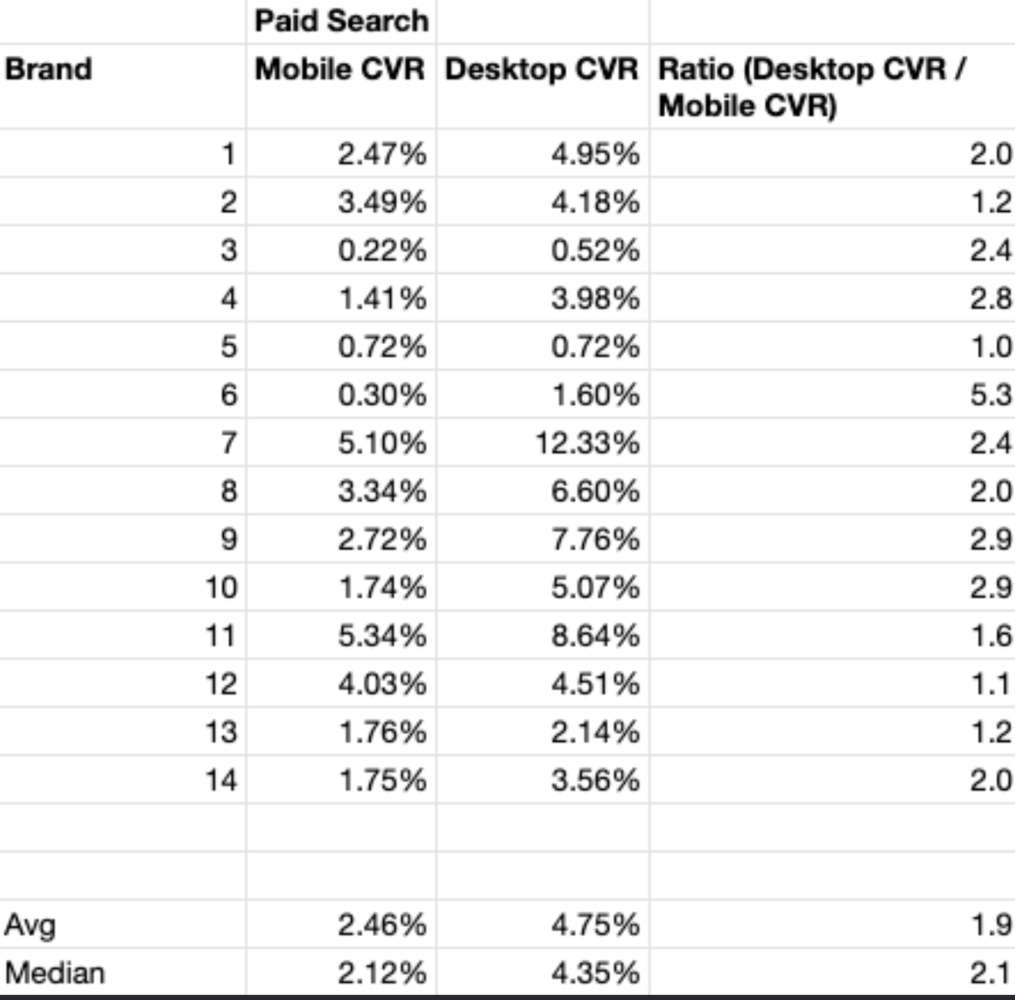
Below are the filtered results by Default Channel Group which more or less confirm the same ratios.
Direct

Organic Search

Paid Search

Conclusion
So there you have it! If you ever are pressed for the classic desktop vs mobile conversion rate comparison, I think 2x is a solid and reasonable answer.